
Windows PE Malware Analysis Part IV
Overview
In Part III we learned how to use x32dbg and performed code analysis on our malicious specimen which uncovered several indicators of compromise. We discovered the purpose of multiple undocumented functions and labeled them both in the debugger and IDA Pro. We also discovered that the application utilizes multiple threads, which can make following code paths a bit more difficult to follow. In this fourth and final part of the series, we will conduct behavioral analysis to capture network traffic, file system changes, and registry modifications. We will detonate the malware using both the REMnux virtual machine and FlareVM, and we will use tools like Regshot, Procmon, and Wireshark to complete our analysis.
Network Setup
NOTE: Prior to detonation, take a snapshot of your FlareVM while powered on either before or after network setup. We will be reverting often.
When we detonate the malware on FlareVM it will more than likely need a way to communicate over the internet for C2 (Command and Control). We saw during code analysis in the last section that the malware makes some requests over HTTPS and there is a public IP address present. Since we are on a host-only network, the malware will not be able to communicate to its C2 server(s). This is resolved by using REMnux as FlareVM's network gateway. We can spoof services like DNS and HTTP so that REMnux will acknowledge all requests originating from FlareVM.
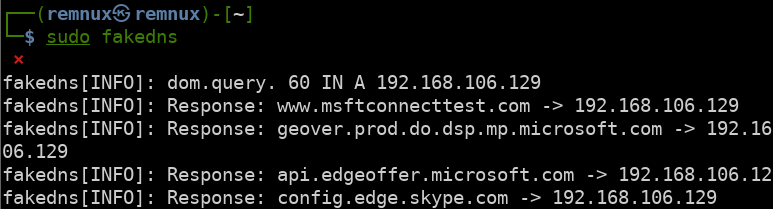
First, we will set REMnux to host-only mode in our virtualization settings. This will ensure both FlareVM and REMnux can communicate with each other. Next, we will run fakedns on REMnux like so:
sudo fakedns
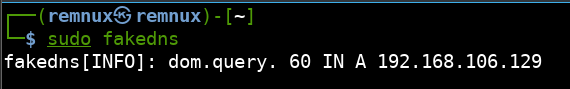
Fakedns will resolve all domain names requested by FlareVM to whatever the IP address of REMnux is.
Next, we will need to ensure all IP addresses are acknowledged using the following command:
sudo accept-all-ips start
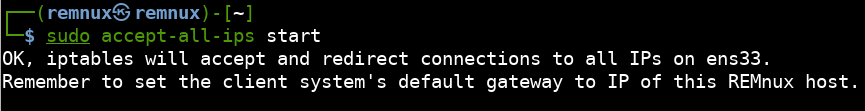
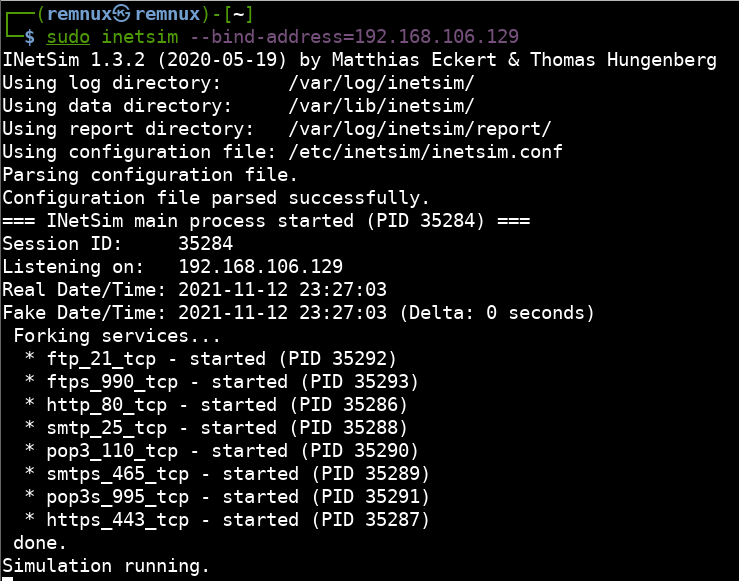
The last thing we need to do on the REMnux VM is spoof common protocols like HTTP/S, FTP, SMTP, etc. Using inetsim we can run multiple fake services that will acknowledge and respond when requested:
sudo inetsim --bind-address=192.168.106.129
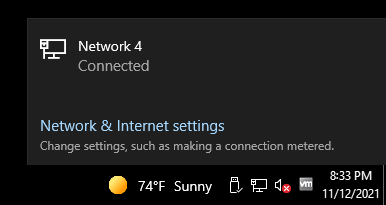
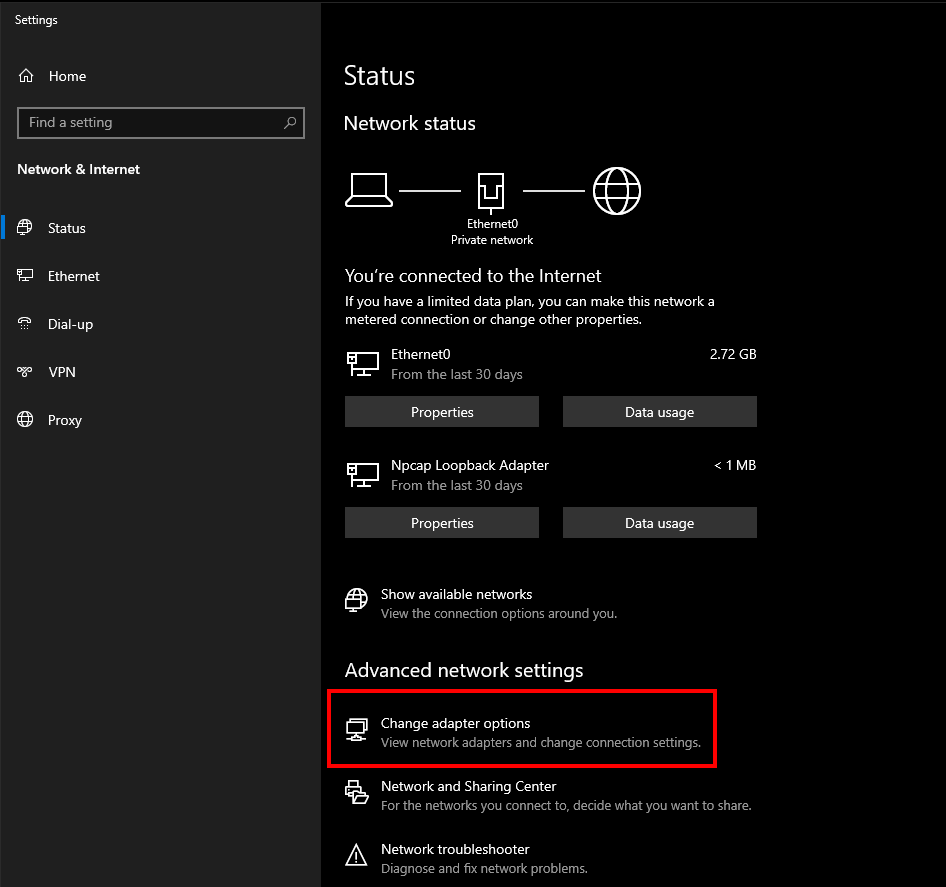
The gateway setup is complete. Now we must prepare FlareVM to send its traffic to REMnux. In the lower right-hand corner of the desktop, click the network icon and then “Network & Internet settings”.
Once the network status window opens, click “Change adapter options”.
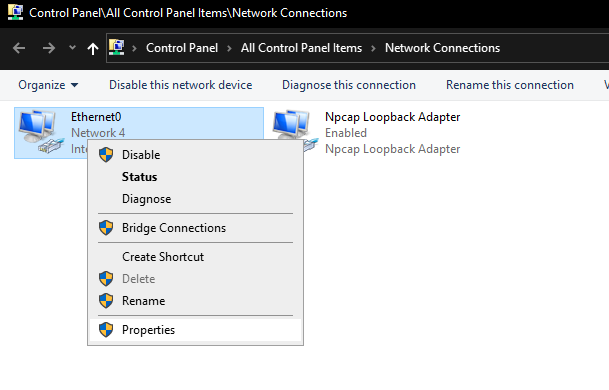
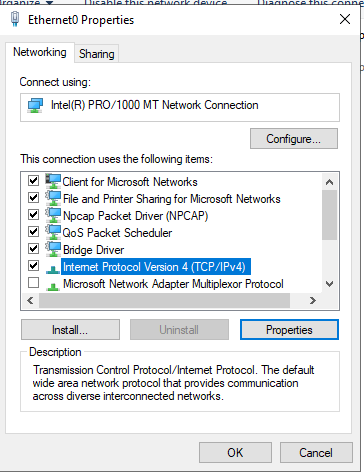
Right-click your network interface and click “Properties”. When the window opens, highlight “Internet Protocol Version 4 (TCP/IPv4)” and click the “Properties” button.
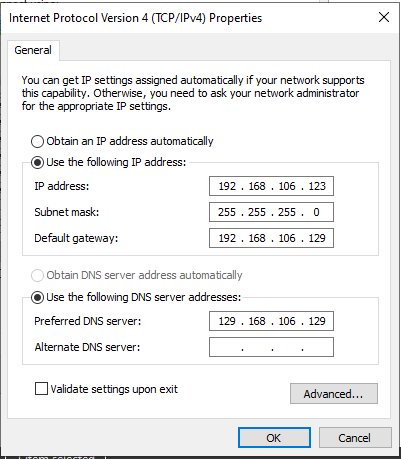
When the properties window opens, check the “Use the following IP address” bubble and fill in the following fields:
- IP address - The IP address of the
FlareVMon the host-only network. - Subnet mask - Should automatically fill out once IP address is added. If not it will be
255.255.255.0 - Default gateway - The IP addresses of your
REMnuxvirtual machine will go here.
Ensure the “Preferred DNS server” portion contains the IP address of the REMnux VM as well. The settings should look similar to what I have below:
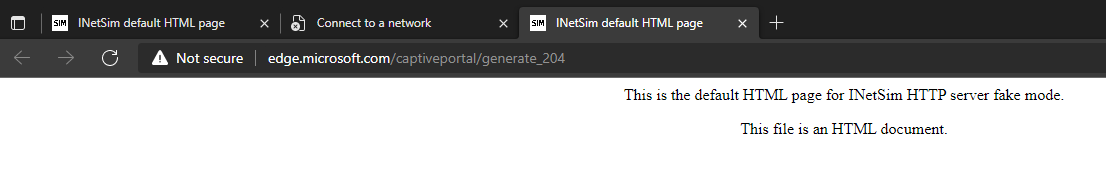
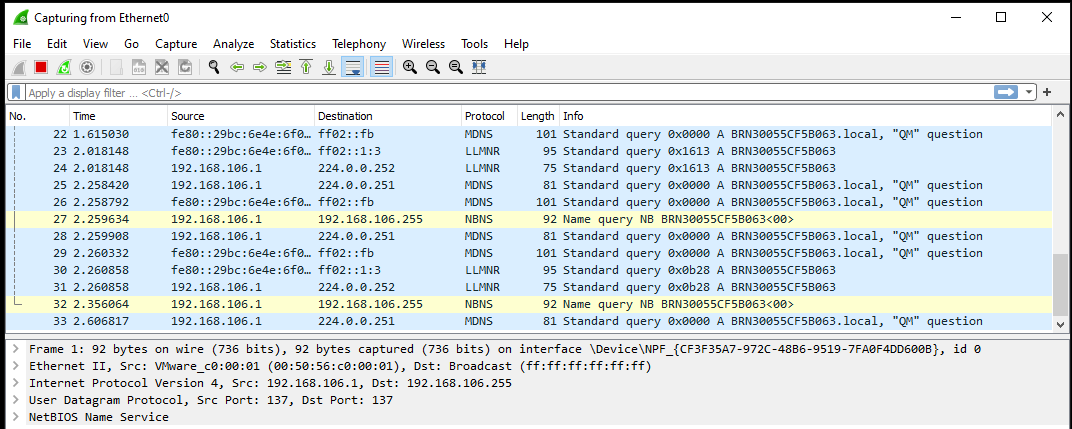
Click “OK” then “Close” to ensure the settings take effect. You should immediately see DNS queries on the REMnux VM’s fakedns output and a browser window open on FlareVM with the default INetSim splash page.
We are now ready to begin our analysis.
Analysis
The idea behind our analysis will be to run one tool at a time and detonate the malware. This way we can focus solely on the output of that tool. After each run we will revert FlareVM back to a clean state, ready to run the next tool.
Regshot
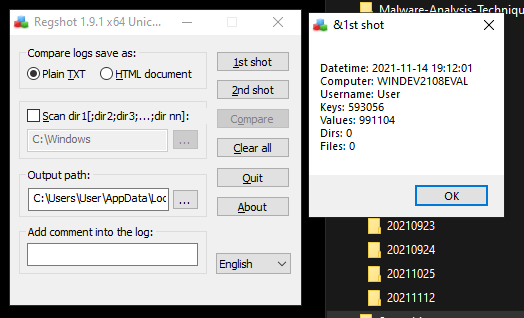
The first tool we will use is regshot. This tool will capture the current state of the registry and file system before and after executing the malware. Once regshot is done with both the 1st and 2nd ‘shot’, we can save the results to a file and examine its output.
Press the “1st shot” button to get the a baseline of a clean system.
Run the malware as administrator to give it complete access, wait for a minute or two, and then click “2nd shot”
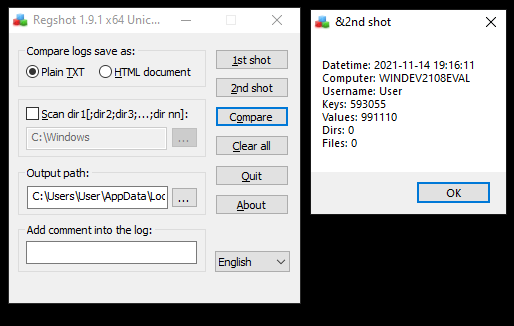
Once the second shot is complete, click “Compare” which will open a text file containing the differences between the first and second shots. Below is an example of the data you will find in the regshot output.
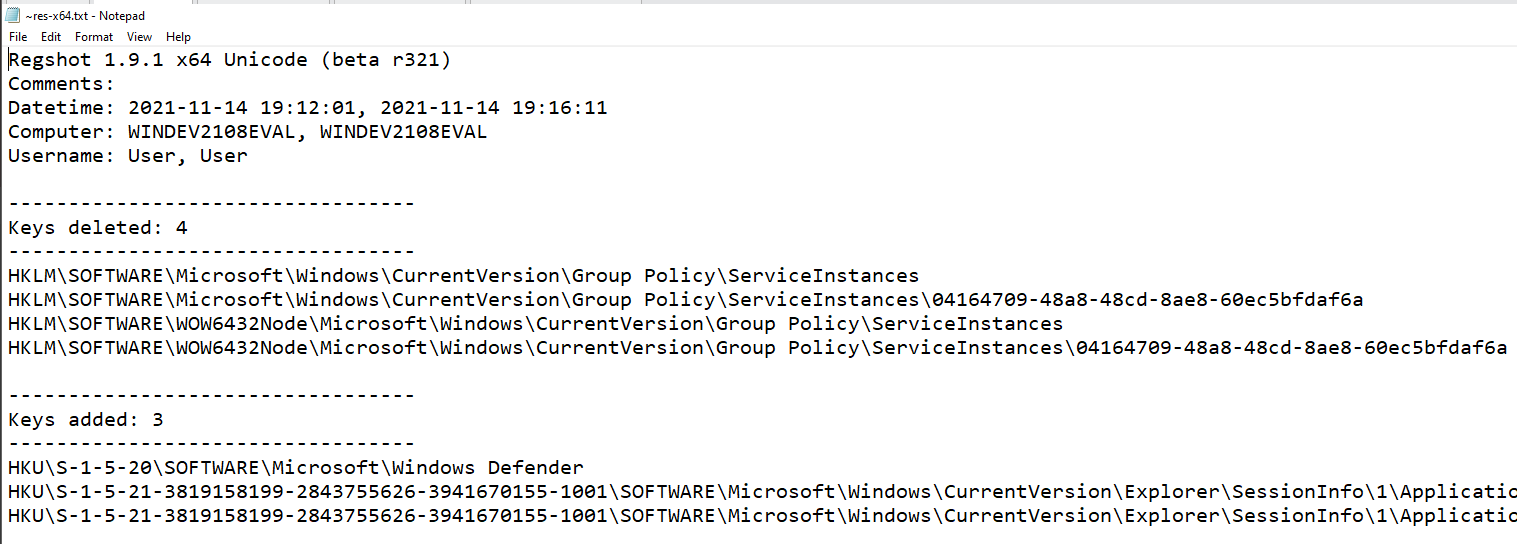
After looking for anything suspicious, I don’t find anything concerning, however, this does not mean that the malware does not modify registry keys. After running the malware you may notice that nothing happens on the screen. There may be some functionality that is hidden to us since the malware is operating in a sandbox with no external internet connection. We will touch more on this later.
Revert to a clean state and begin analysis with the next tool.
Procmon and ProcDOT
We can use the Sysinternals tool procmon to log all of the system operations that the malware uses. We can then extract that information to a CSV file and import it to procDOT to visualize the specimen’s actions.
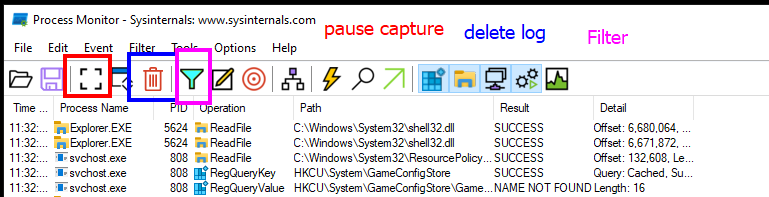
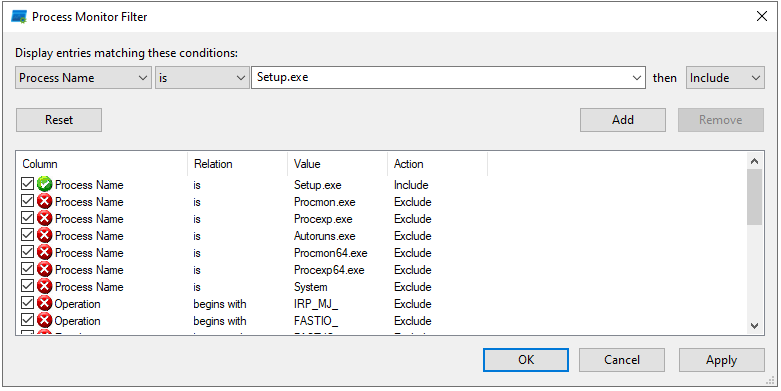
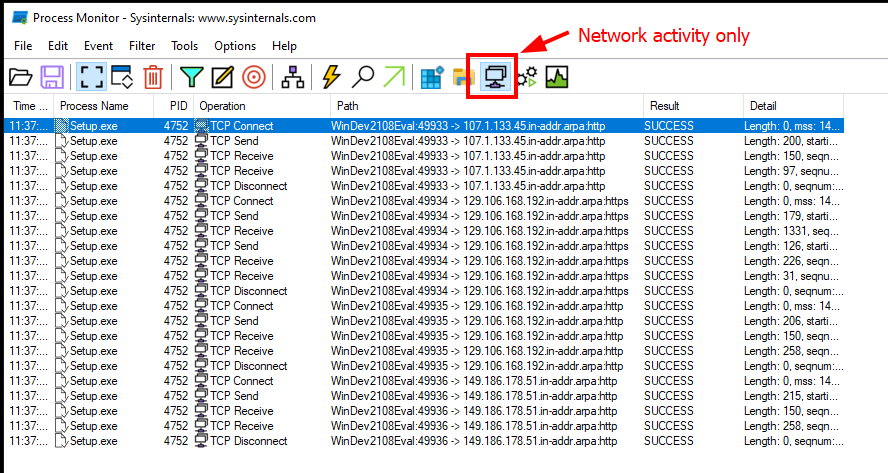
First, start by opening procmon and pausing the capture. By default procmon will capture all events for every process which can eventually bog down the system. To avoid this we will need to filter on the name of our malware. In my case, the malware is named Setup.exe.
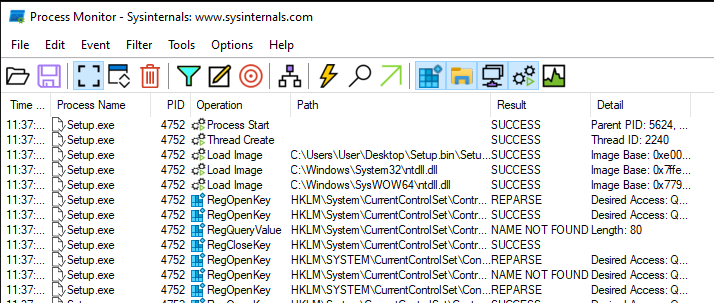
Once the filter is set, start the capture again, run the program and examine the captured operations.
If we filter by network activity only, we can see a couple interesting IP addresses we have not seen before in reverse order.
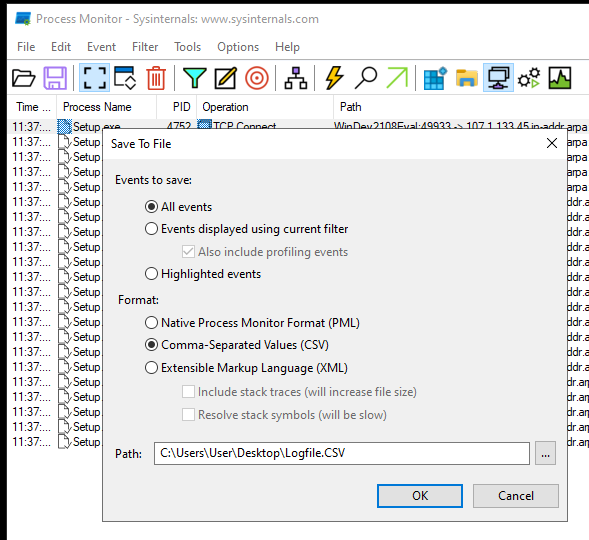
Let’s export this to a CSV. Click the save icon and take note of the save path and filename.
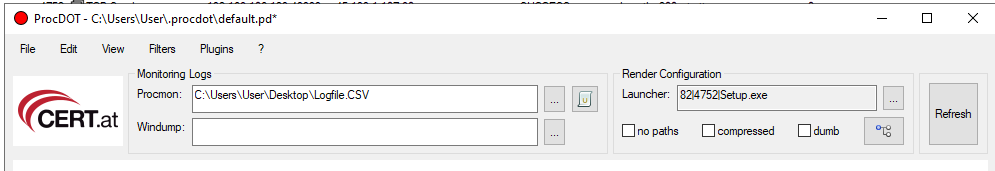
Open up procDOT and open the CSV file. Select the name of the malware under “Launcher” and click the refresh button.
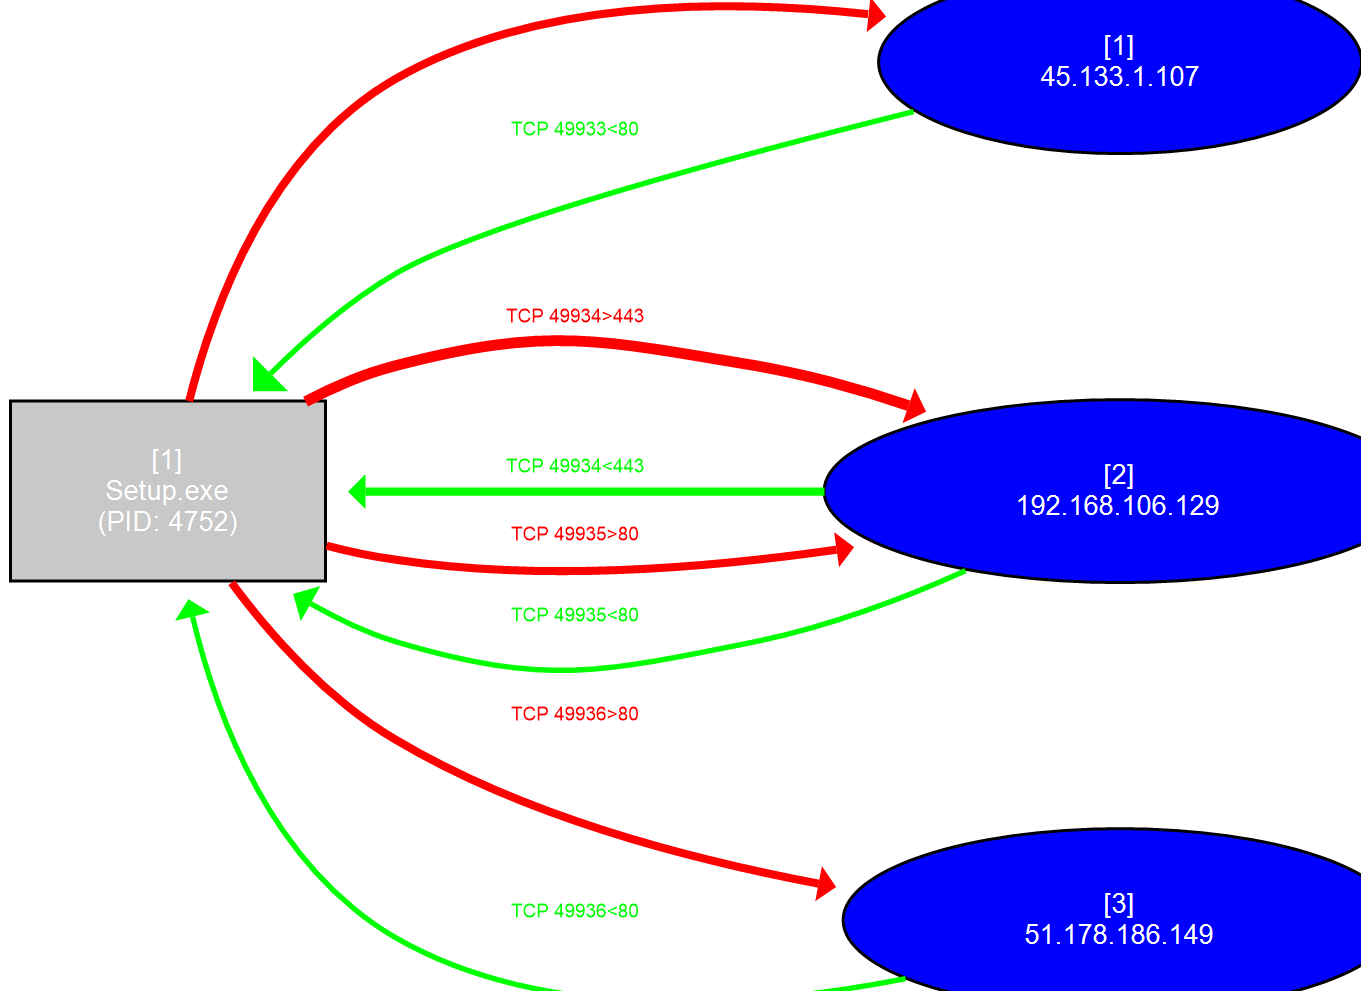
The output should render a graph with the TCP connections we saw earlier. Based on the graph, the malware is communicating with a few external IP addresses over HTTP and HTTPS. One of the IP addresses is my REMnux IP address. The malware is probably trying to reach a specific domain name and in order to do so, it needs to query its gateway router’s DNS entries. We will confirm this in the next section.
Wireshark
Using Wireshark on FlareVM we can capture all network traffic in a pcap file and filter through it for suspicious domains and IP addresses.
Startup Wireshark on FlareVM and sniff traffic on your main network interface.
Run the malware for about a minute then pause the Wireshark capture. Let’s see if we can filter through the traffic for the IP addresses we discovered earlier with procmon.
Using the display filter toolbar lets first filter by HTTP.
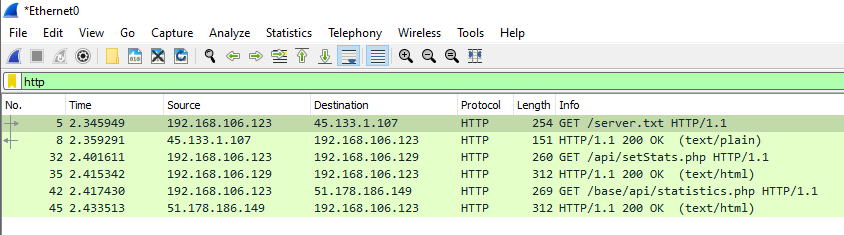
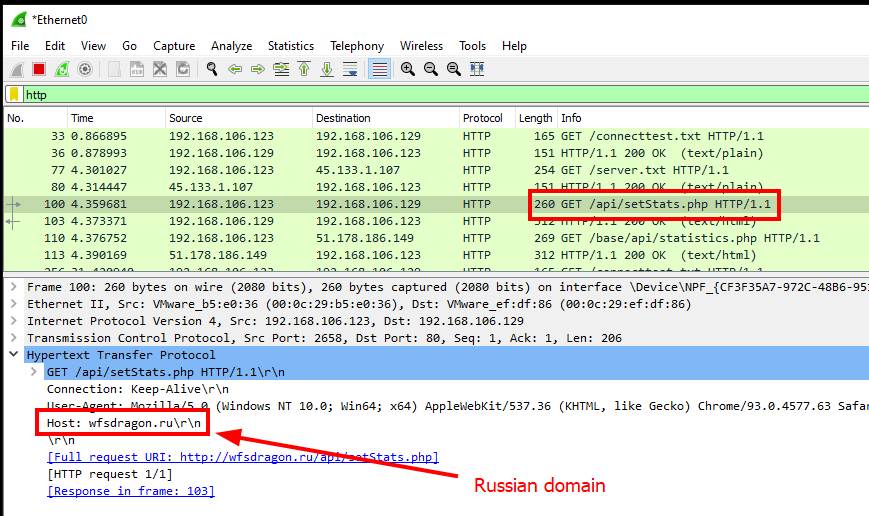
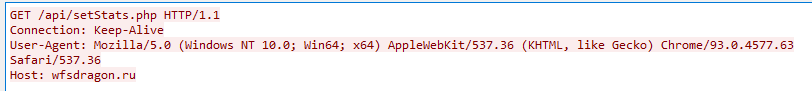
We see that the specimen made three GET requests to 3 different IP addresses. We can see the three IP addresses are the same addresses we discovered earlier with procmon. If we take a look at the HTTP headers for the request to /api/setStats.php with the destination IP of 192.168.106.129 we see a request to the domain wfsdragon.ru.
We can also see this in our fakedns output.

More Analysis…
At this stage, the malware doesn’t appear to do much. Every time we execute it, nothing happens on the screen and a few HTTP requests are made on the back end. Let’s take what we have and try to extract some more information.
Using the command-line tool cURL, we can request the content of web pages to be displayed on the terminal. This is safer than opening the URL in a browser because it mitigates the potential for a drive-by compromise. We have three different URLs to try:
http://45.133.1.107/server.txt
http://wfsdragon.ru/api/setStats.php
http://51.178.186.149/base/api/statistics.php
On a machine with cURL installed and internet access, I request each URL and receive different output from each.
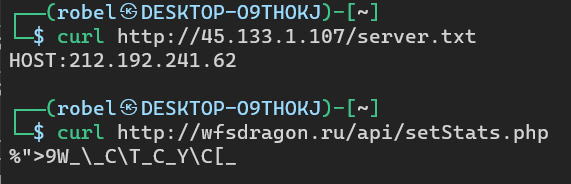

The first request returns a new IP of 212.192.241.62. The next request returns some gibberish and the last request fails.
I took the IP address 212.192.241.62, and swapped one of the URL addresses with it. When requesting the URL with cURL, I received a long string of random characters:

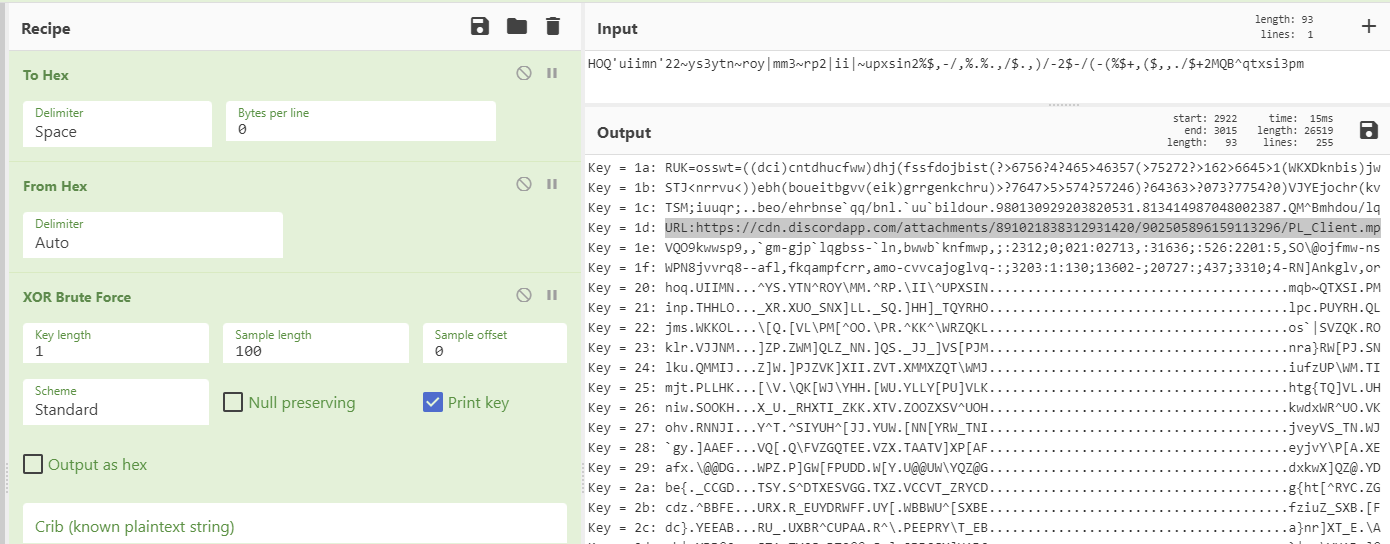
I copied the string and ran it through an XOR brute force function in CyberChef
When the string “HOQ'uiimn'22~ys3ytn~roy|mm3~rp2|ii|~upxsin2%$,-/,%.%.,/$.,)/-2$-/(-(%$+,($,,./$+2MQB^qtxsi3pm” is XORed with the byte 0x1D, it becomes:
URL:https://cdn.discordapp.com/attachments/891021838312931420/902505896159113296/PL_Client.mp
A GET and POST request to the newly discovered URL returns the following:
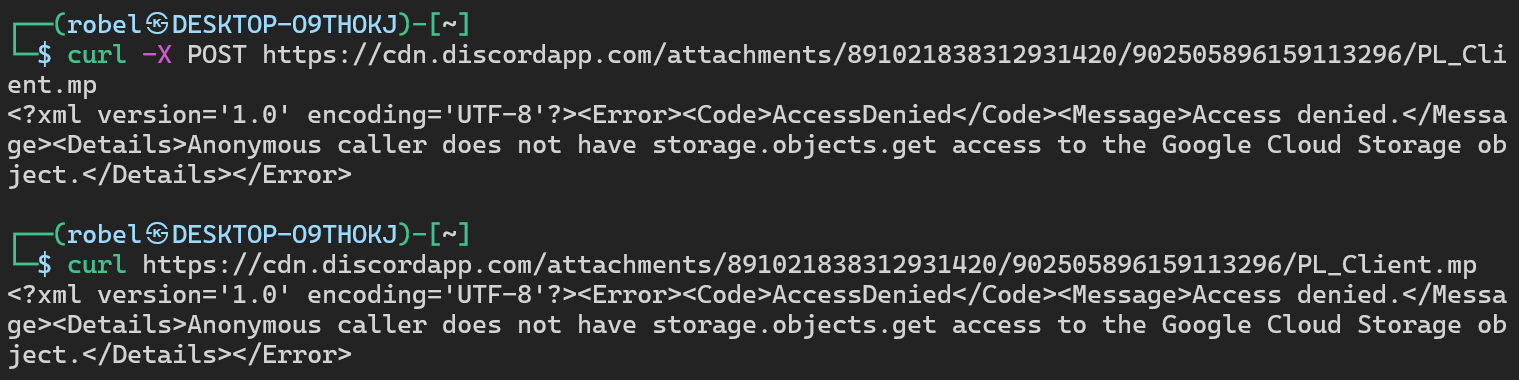
We get a common Google Cloud Access Denied error message in XML :
<?xml version='1.0' encoding='UTF-8'?><Error><Code>AccessDenied</Code><Message>Access denied.</Message><Details>Anonymous caller does not have storage.objects.get access to the Google Cloud Storage object.</Details></Error>
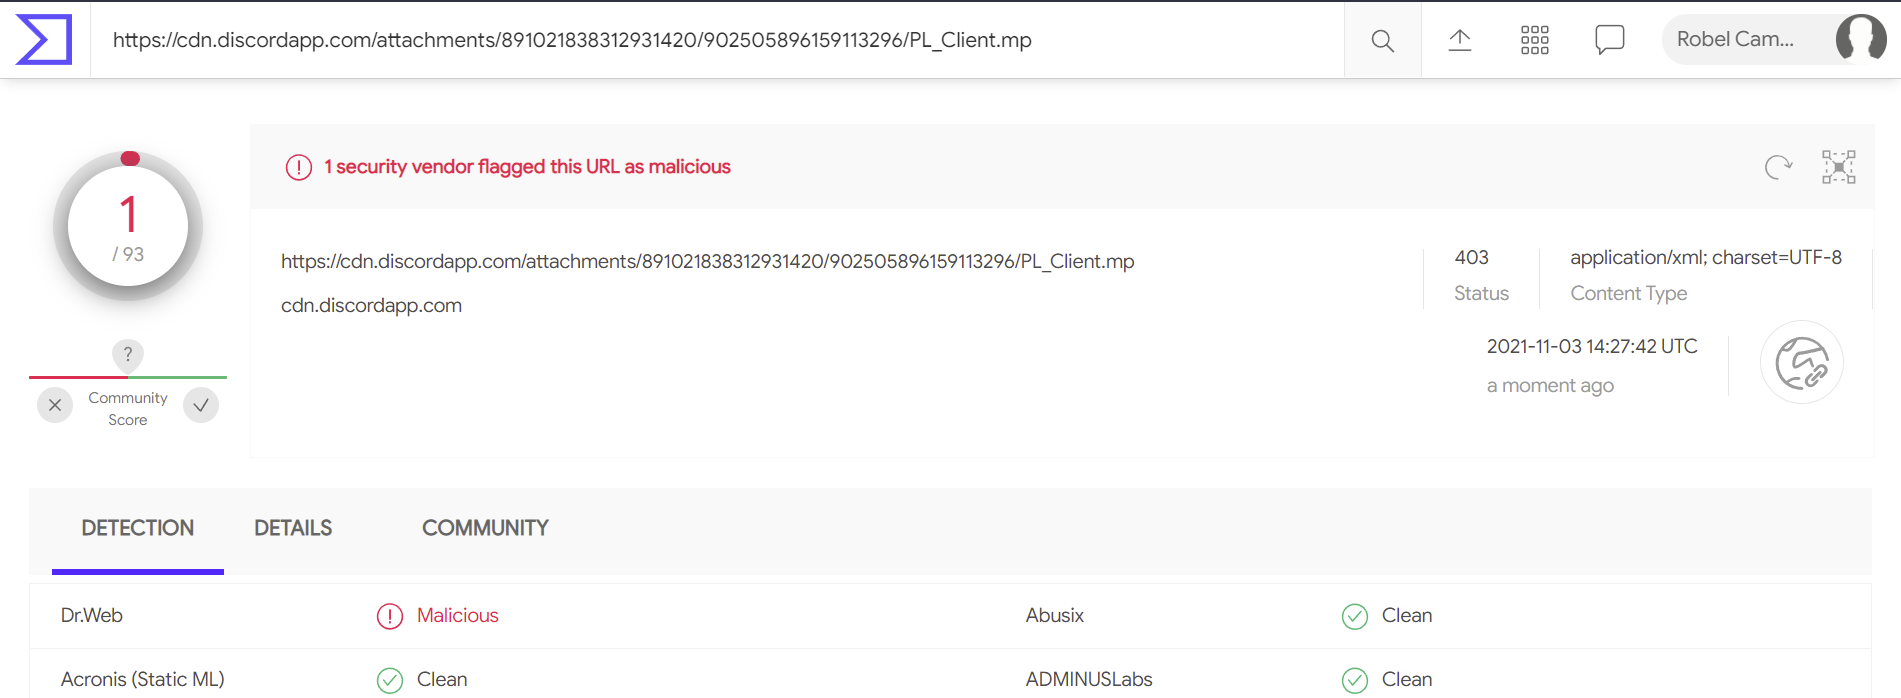
A search for the URL in VirusTotal yields that only one engine detects it as malicious:
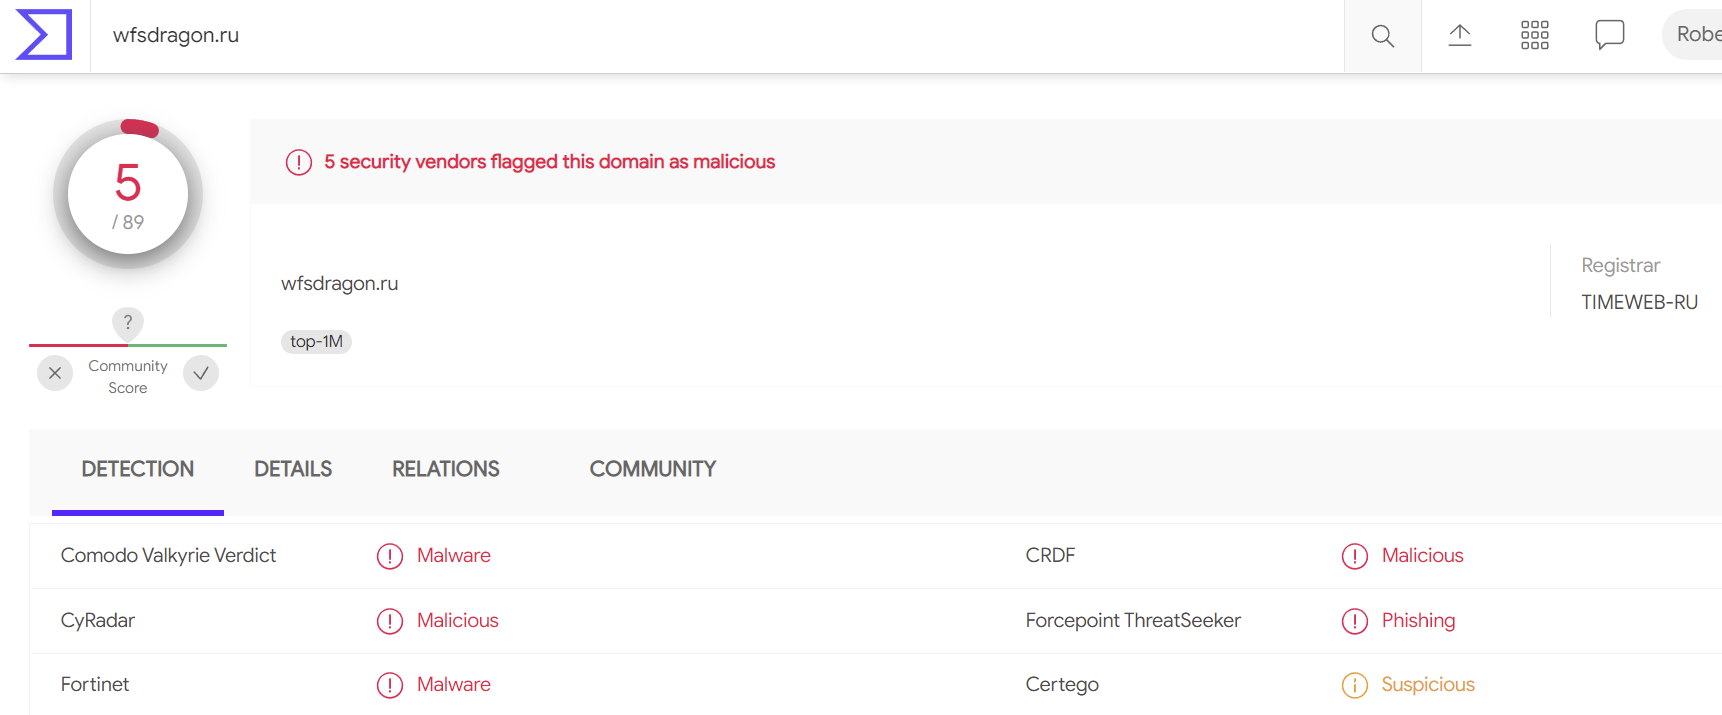
Five security products flag the wfsdragon.ru domain as malicious:
Final Detonation?
By the time I wrote this section of the article, the external IP addresses and domain that the malware uses to carry out the rest of its functionality were unresponsive. A week or so prior, when detonating the malware with internet access you can see several programs downloaded and executed on the system. You can get a quick glimpse of the desktop activity on Any.Run which is where we originally obtained the malware. The sandbox on Any.Run has loads of captured information on the specimen and is worth checking out.
Part IV Conclusion
In this fourth and final part of the series, we conducted behavioral analysis using our own isolated sandbox and common monitoring tools. We also discovered several new IOCs that can be added to our detection tools. Unfortunately, we were unable to see the full features of the malware, but we can rely on other automated sandboxes like Any.Run to provide us with the information we need.
This concludes the Windows PE Malware Analysis series. I hope anyone who followed along found these articles helpful. Please provide any feedback and submit any suggestions you may have for future articles!