
Windows PE Malware Analysis Part III
Overview
In Part II we concluded our static analysis by becoming familiar with IDA Pro and using it to confirm one of our previous findings and to examine obfuscated strings on the stack. In this article, we will be conducting code analysis. Code analysis involves examining the code that comprises the specimen, only this time in a dynamic fashion. We will be using x32dbg as our debugger. The goal of Part III is to demonstrate how we can step through the malware’s instructions and allow it to automatically reveal information about itself that is otherwise “invisible” while not running.
x32dbg
x32dbg is the 32-bit debugger that is a part of the open-source x64dbg software package. It is probably my favorite user mode Windows debugger due to its ease of use and friendly user interface. Let’s briefly go over some of the important features of this debugger before we begin analysis.
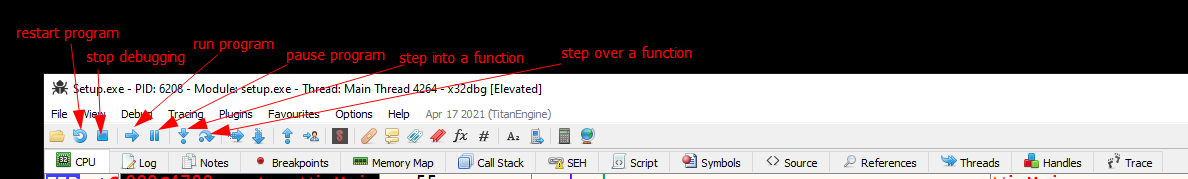
Here is a brief description of the main buttons on the toolbar:
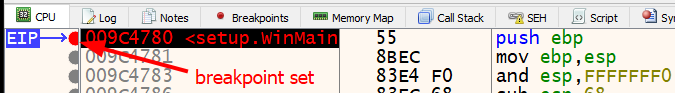
If you need to set a quick software breakpoint, just click the circle to the far left of the line. When set, it will be highlighted red:
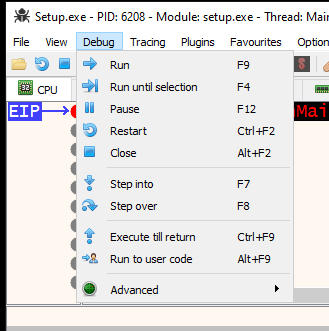
The “Debug” menu option contains all of the controls described earlier with their associated keyboard shortcuts:
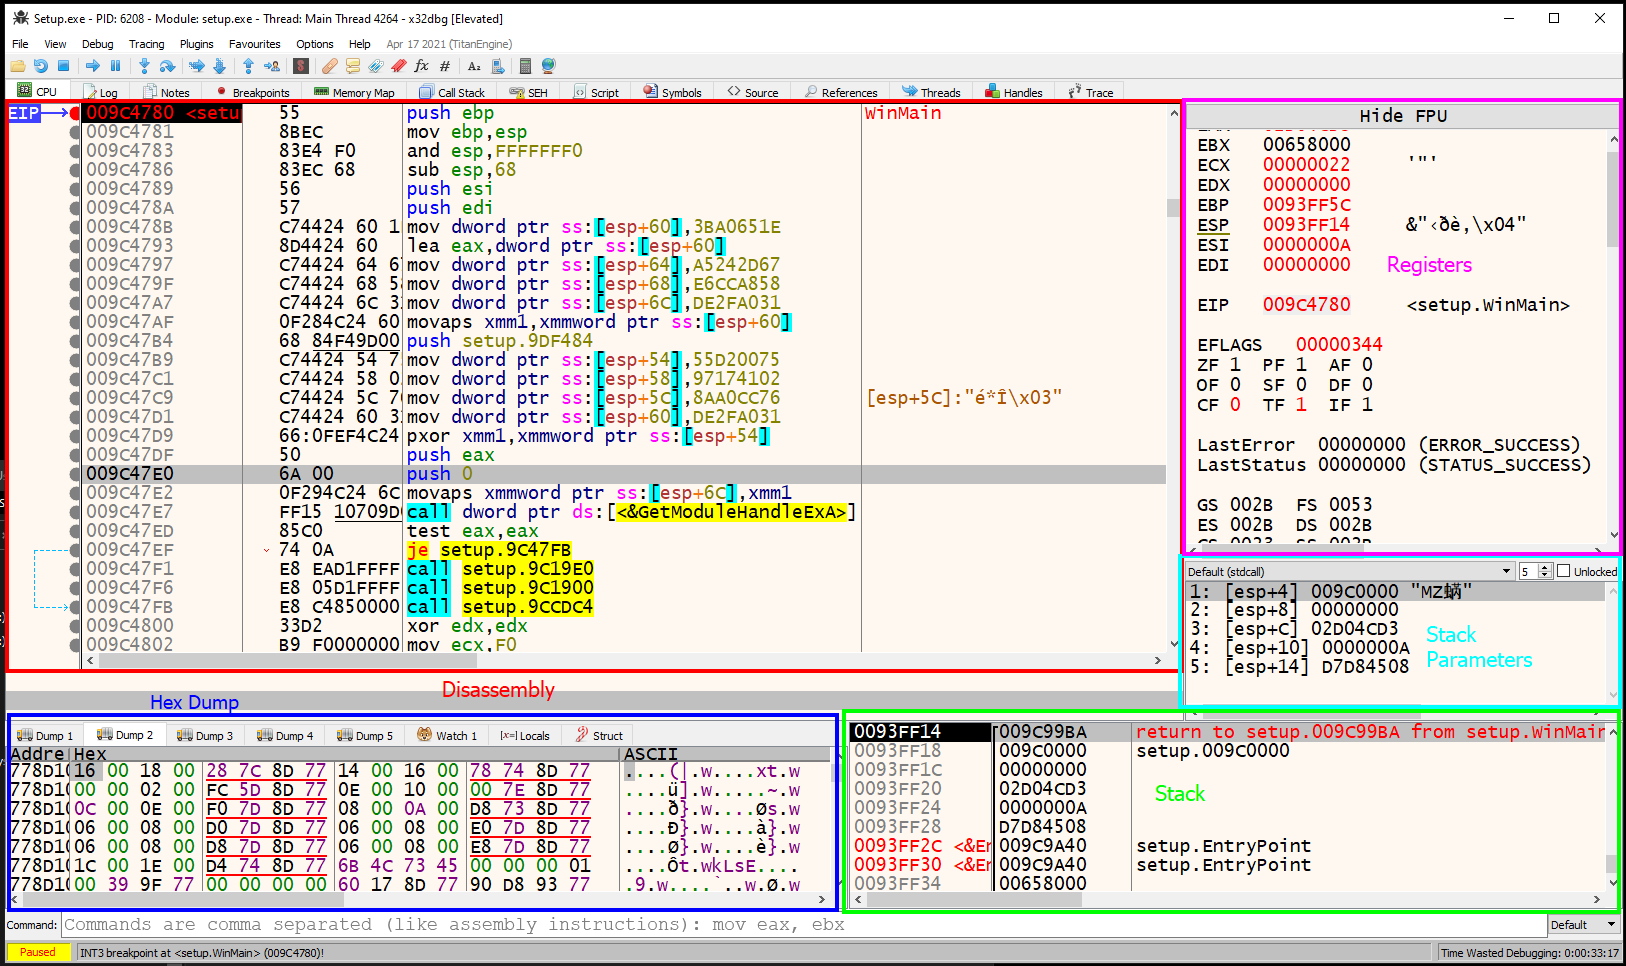
The CPU tab layout is where we will spend the most time debugging. It contains the disassembly view, the registers view, the hex dump memory view, the stack parameters view and lastly the stack view.
More features will be revealed as we go. Let’s move on and load the binary.
Initial Setup
NOTE: Please ensure you are on a Host-only network adapter in your virtual machine.
- Open the binary in x32dbg: File > Open. The debugger will open the malware and set a breakpoint on the initial loading instructions in ntdll.dll.
-
Press the “Run” button or
F9on the keyboard once until user code (setup.exe)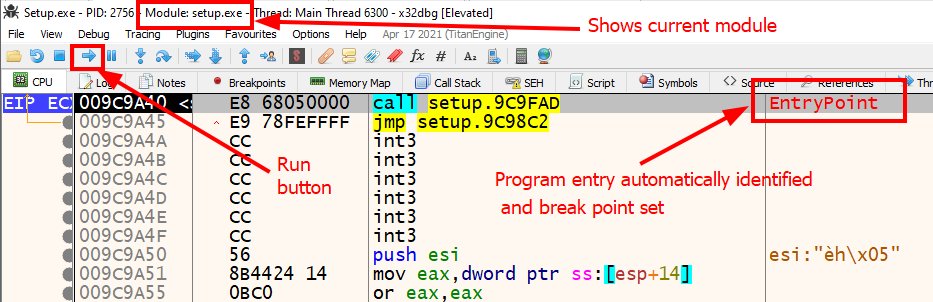
-
Take note of the PE base address in x32dbg’s “Memory Map” tab and rebase IDA accordingly. Rebasing IDA is optional but since I like to use IDA alongside a debugger, I want to make sure the addresses match. If you recall in Part I of the series, we ran
pesecon the specimen which revealed that ASLR is enabled. This means the higher two bytes of the malware’s memory addressing will be different between boots. Without opting into ASLR, the base address in virtual memory would always be0x00400000. This is based on the PE’s header information.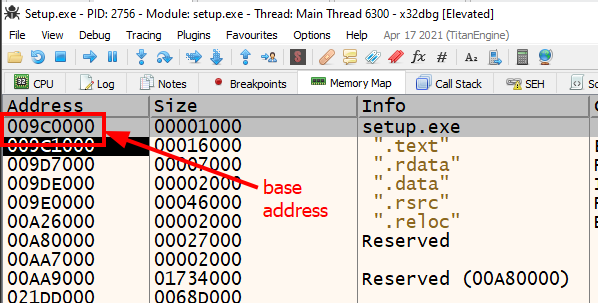
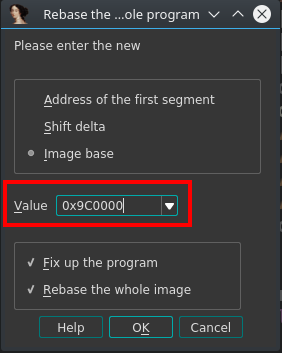
In IDA menu: File > Segments > Rebase program…
-
Set a breakpoint on
WinMain()function at offset0xXXXX4780(Higher two bytes will be different for you.) and run until it breaks. If you prefer, label the first line as “WinMain” by highlighting the line and pressing theShift+;keys. Verify the addresses match in both x32dbg and IDA.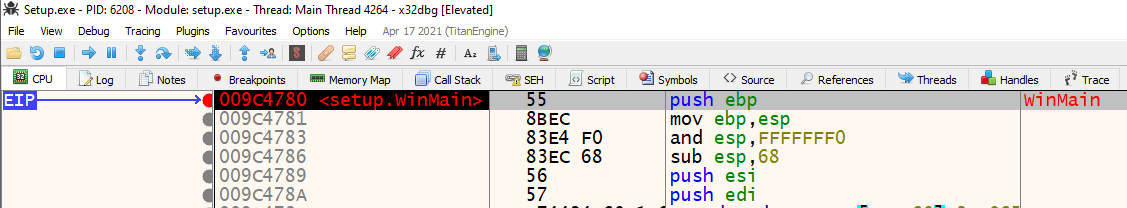 WinMain() in x32dbg
 WinMain() in IDA
We are now ready to jump into our analysis.
Analysis
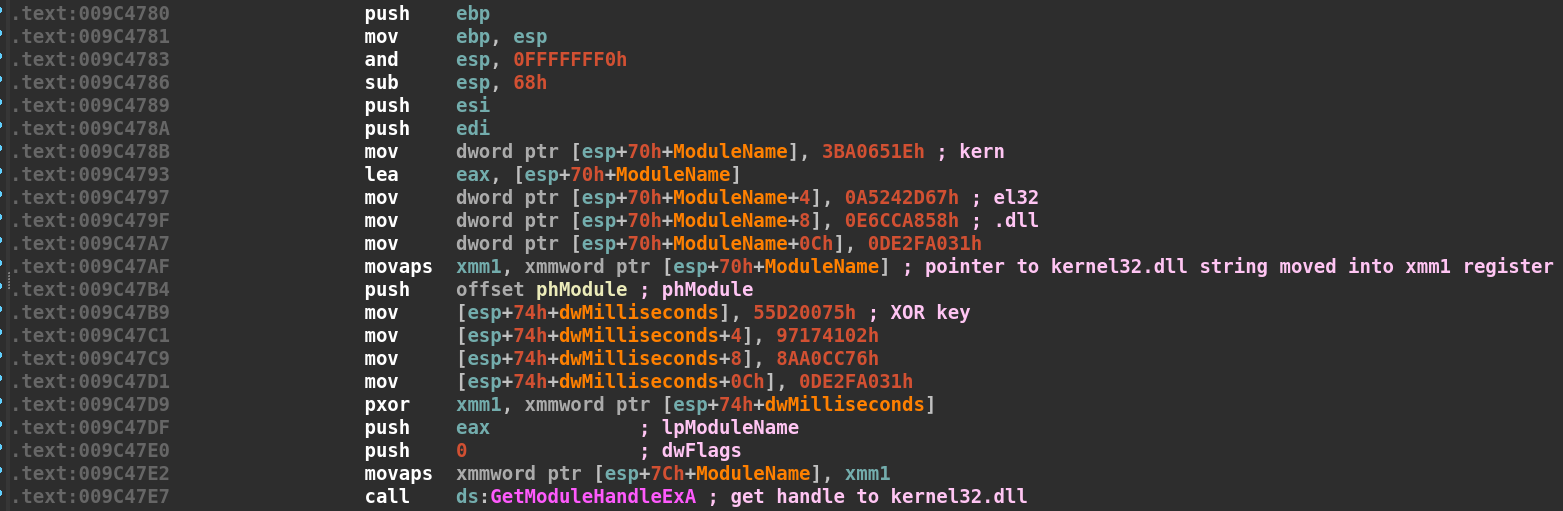
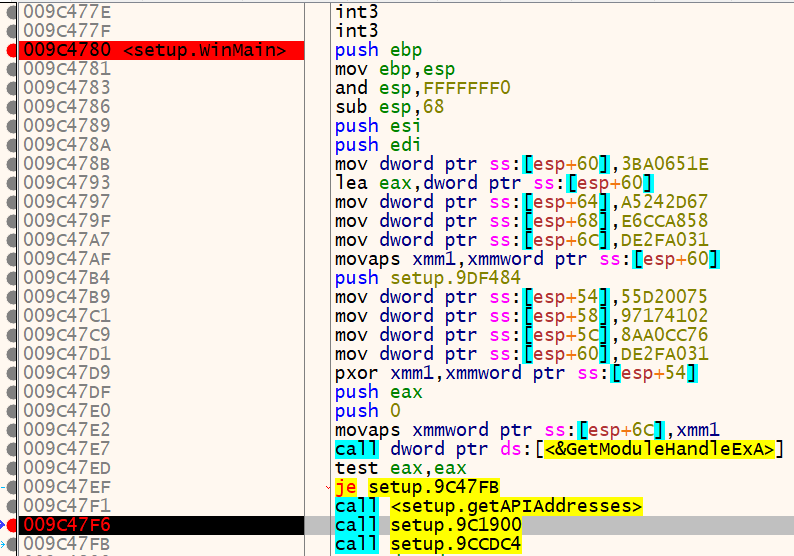
Let’s start with the first block of the WinMain function as we did in part II of the series. If you recall, the first block contained a stack string that would deobfuscate itself at runtime through a pxor instruction and become and the lpModuleName parameter for GetModuleHandleExA. Below is a screenshot from IDA:
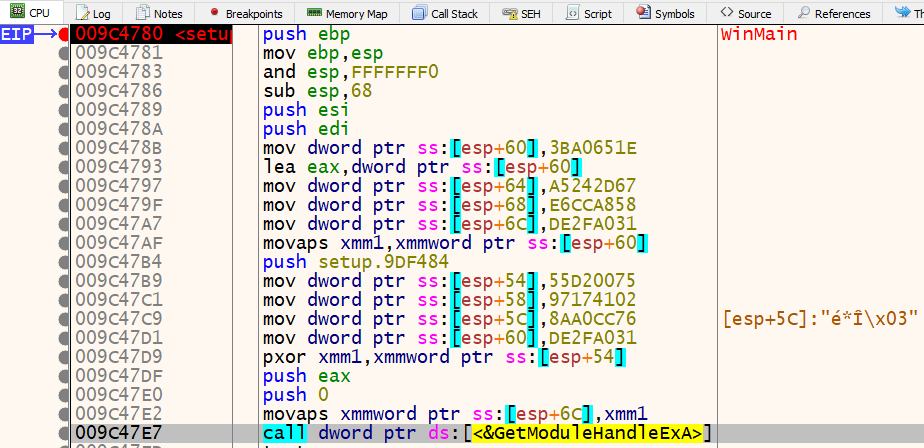
In x32dbg, we see similar code, but with the exception of IDA’s automatic labeling.
If we set a breakpoint on call dword ptr ds:[<&GetModuleHandleExA] at address 0x009C47E7 and run the program, we will see the parameters on the top of the stack that are passed to GetModuleHandleExA. The debugger will also show you what values are stored in each register, especially if it is a string. Take a look at the stack and the registers in x32dbg.
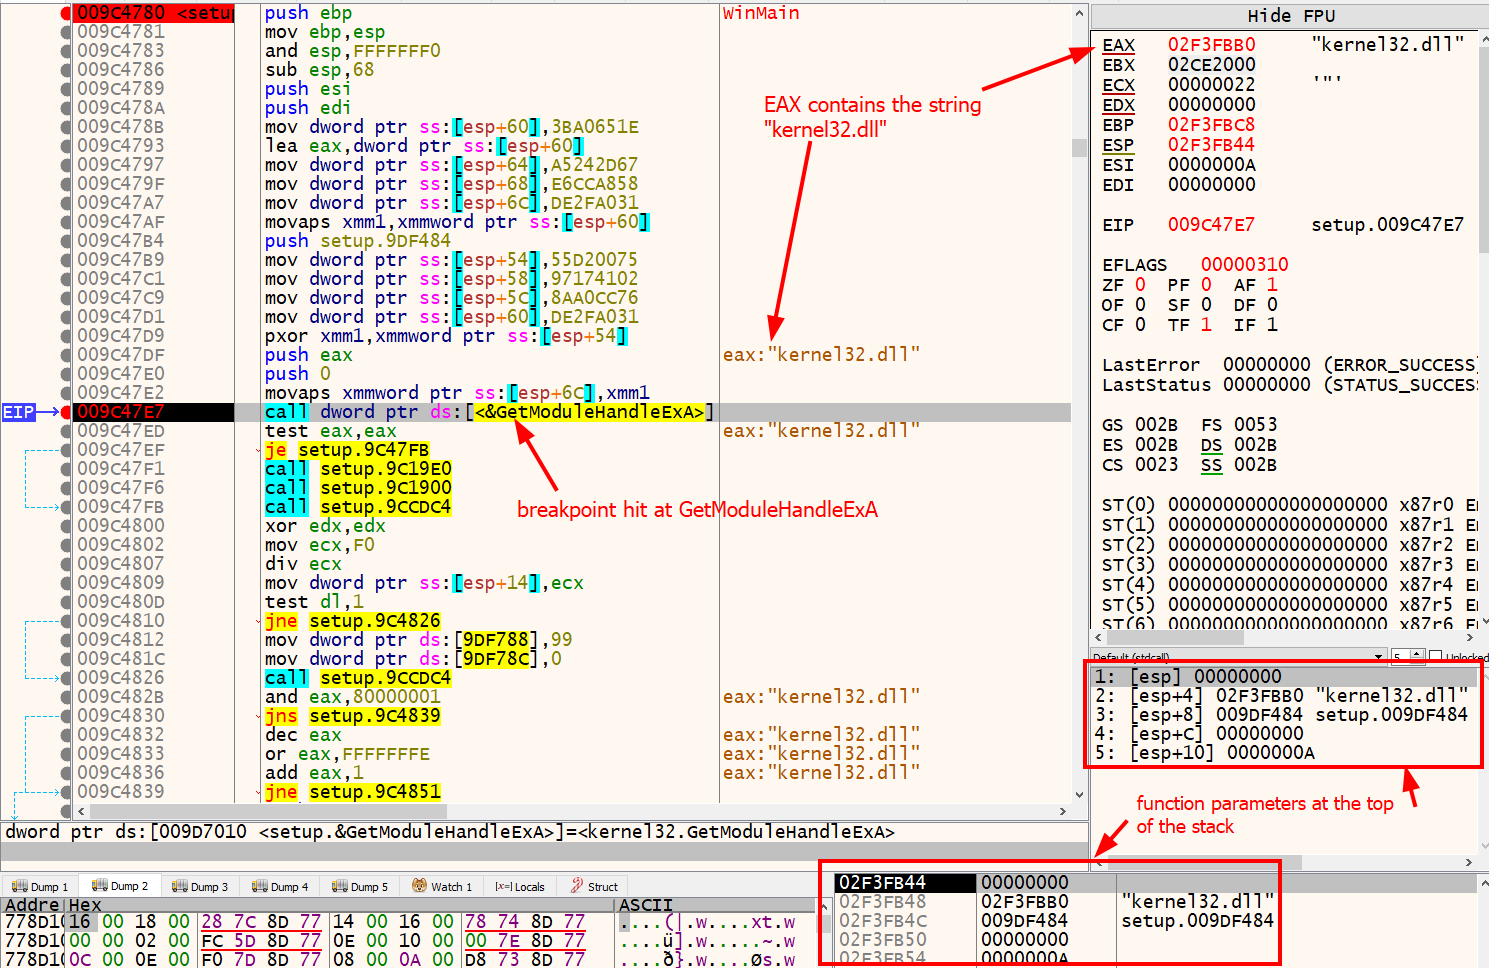
Without performing any extra work via manual or automated static analysis, we were able to reveal the lpModuleName parameter simply by letting the program decode itself. We see again that the specimen is trying to get a handle to kernel32.dll.
This is the basic premise we will use for the rest of our code analysis. When we see call instructions, we will set a breakpoint on the call and examine the stack for parameters. This saves us the pain of figuring out what function each encoded stack string belongs to.
Shortly after the call to GetModuleHandleExA, we see another function call to address 0x009C19E0. This is either a user-defined function or the debugger is unable to identify the library function. Let’s set a breakpoint there, run the program once again and step into the function with the F7 key. The debugger should look like this:
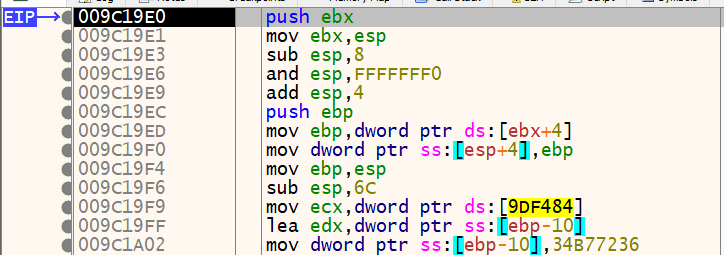
If you scroll through this function, you will see multiple mov instructions that are very similar to the stack strings we decoded earlier. You can also see the pxor instruction after the static XOR key we saw from before. We can safely assume that there are multiple stack strings to decode in this function.
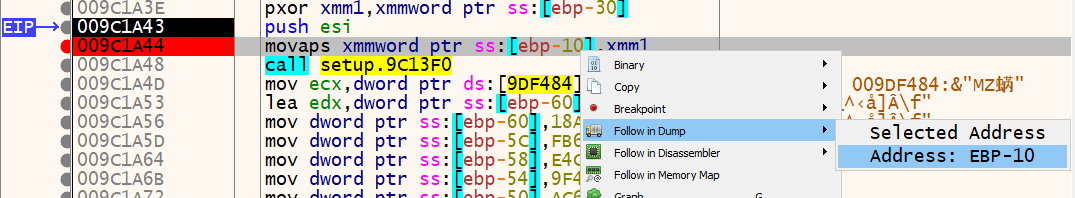
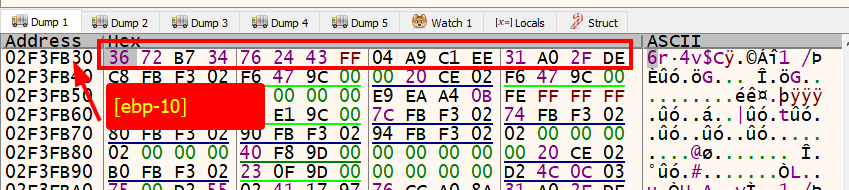
Let’s start with the first set of strings and set a breakpoint at 0x009C1A44 which is the movaps xmmword ptr ss:[ebp-10], xmm1 instruction, then run the program. At this point, the result of the pxor instruction is stored in the xmm1 register and it will be moved back into the original location of the encoded string. If we right-click [ebp-10], highlight “follow in dump” and click the address, we will see the hex dump memory view jump to that location.
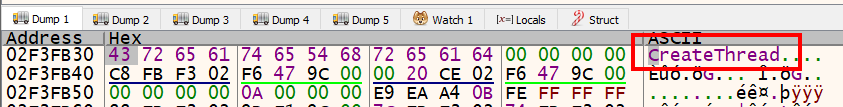
If we press the F8 key to step-over one instruction and examine [ebp-10] again in the hex dump, we see the string CreateThread was written there. We successfully decoded another stack string dynamically.
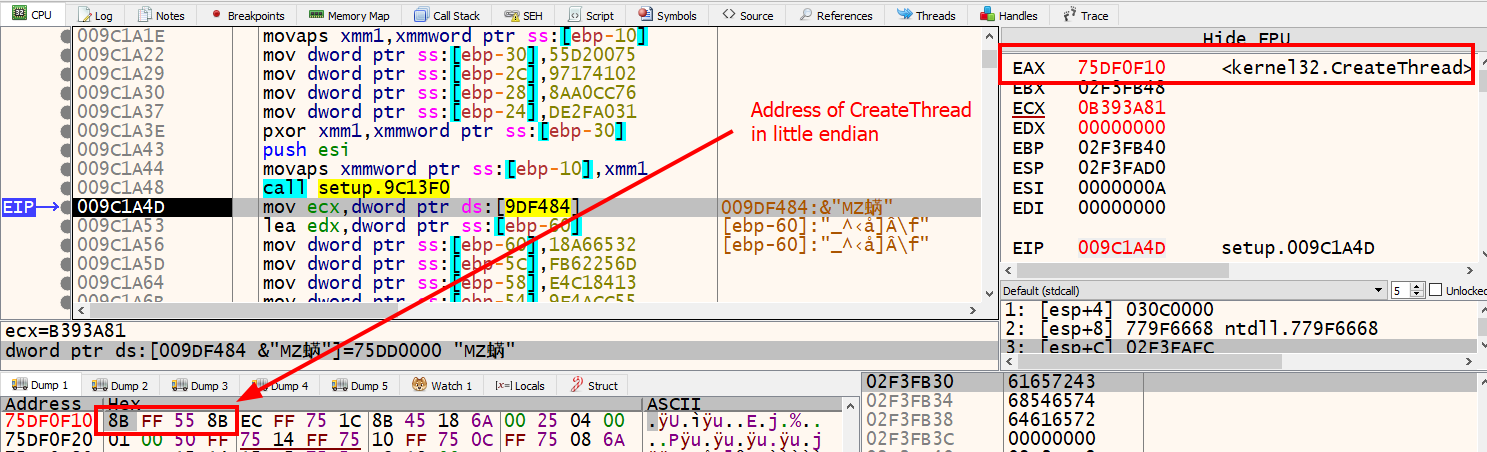
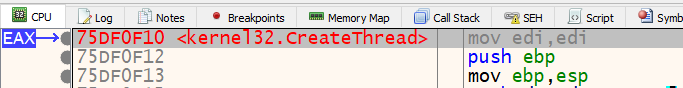
At this point, we should be paused at call setup.9c13f0 at address 0x9c1a48. The function located at 0x9c13f0 is called repeatedly throughout the current function right after the movaps xmmword ptr ss:[ebp-XX], xmm1 instruction. We can assume that the resulting decoded stack string is passed as a parameter to this function. Rather than diving into that function, Let’s step over it and examine the eax register. The eax register is commonly used to store the result of a function. In this case, we see that eax contains an address that is a pointer to the location of the CreateThread API in kernel32.dll.
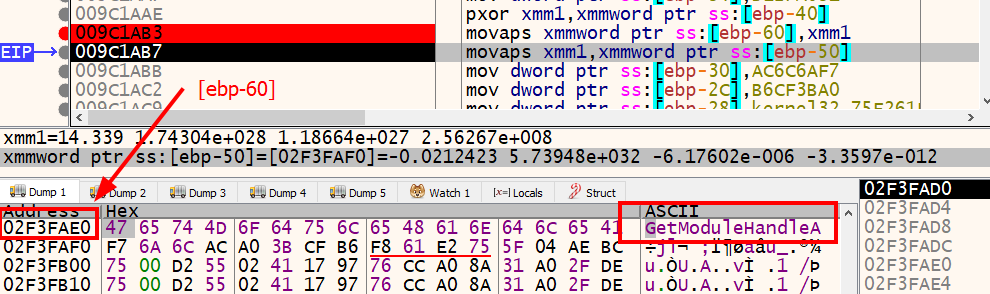
It looks like the function at 0x9c13f0 is responsible for locating the address of specific APIs. Let’s confirm this once more by decoding the next set of stack strings and looking at the result of the function call again. Set a breakpoint on the next movaps xmmword ptr ss:[ebp-60], xmm1 instruction at address 0x009C1AB3 and press F8 to step once to the next instruction. This will deobfuscate the next stack string and move it back into [ebp-60]. This time the string is GetModuleHandleA.
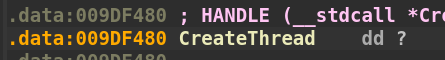
Before we call the function at 0x9c13f0 again, we see the following move instruction: mov dword ptr ds:[9DF480],eax. This instruction is taking the value stored in the eax register, which is the result (pointer to CreateThread) of the last call to 0x9c13f0, and storing it at memory address 0x9DF480. This address is in the .data section of the binary. Let’s check it out in IDA.


The move instruction takes the pointer to CreateThread and updates the .data section with the address. This is another frequently executed instruction found in the overall subroutine we are examining. Let’s rename the placeholder dword_9DF480 variable name in IDA to CreateThread.

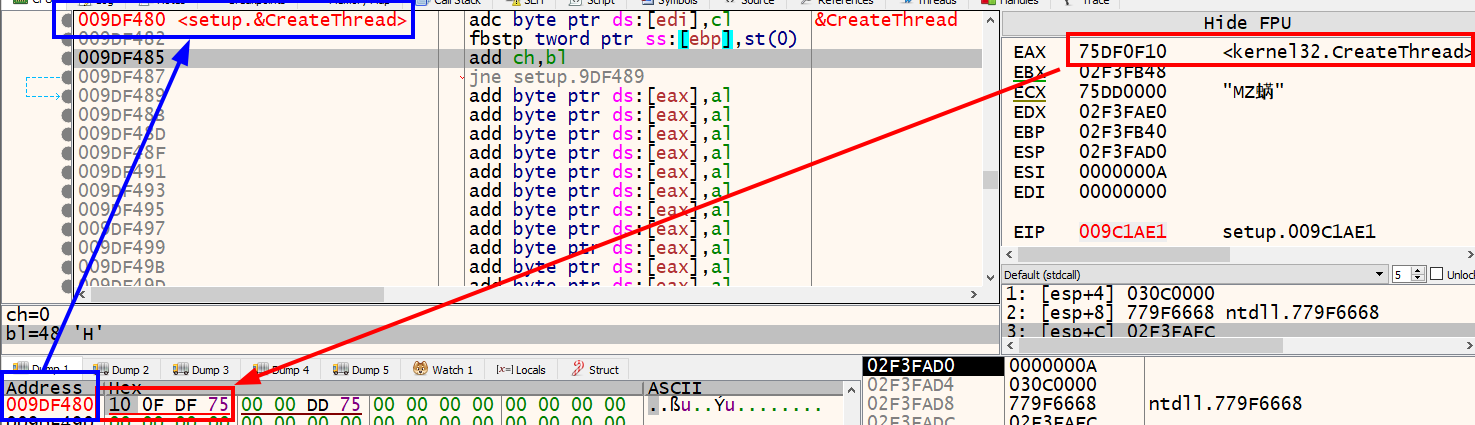
If we follow the address 0x9DF480 in the hex dump, set a breakpoint on 0x009C1ADC and step over once, we see 0x9DF480 went from 00 00 00 00 to
10 0F DF 75 which is 0x75DF0F10, the address of CreateThread in kernel32.dll.
Step over one instruction to land on the call to 0x9c13f0 at address 0x009C1AE5 and examine the stack values. The fifth parameter is pointing to the string GetModuleHandleA that was revealed earlier.
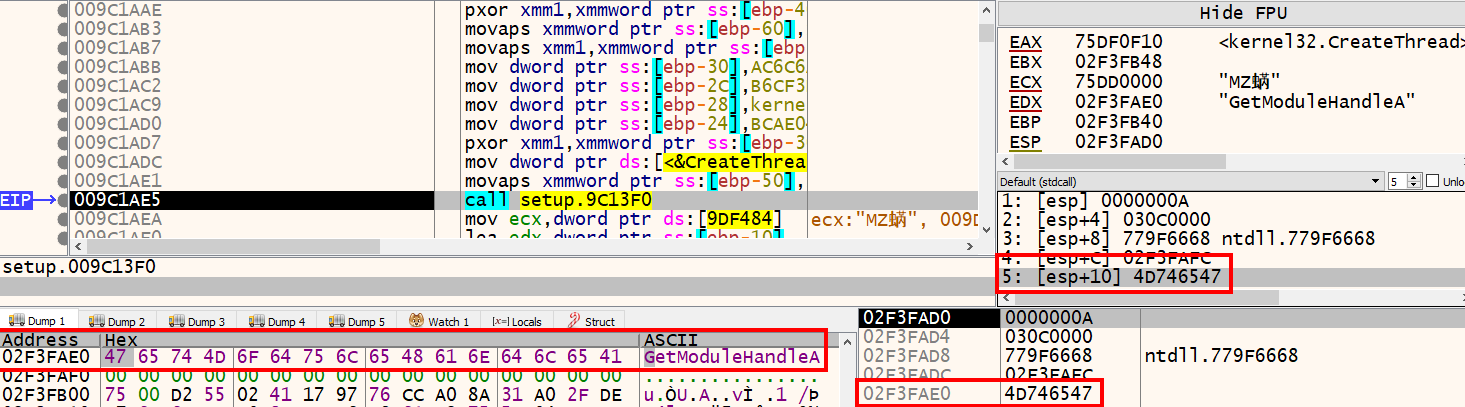
Step over once more and take a look at the eax register. It contains a pointer to GetModuleHandleA in kernel32.dll. We can confirm that the function 0x9c13f0 is responsible for resolving API addresses.

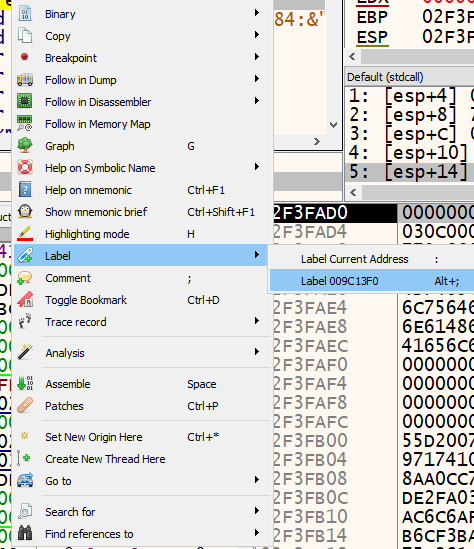
Let’s right-click [0x9c13f0] in the debugger and select “Label” > “Label 9C13F0”, then rename the function to something like resolveAPIs.

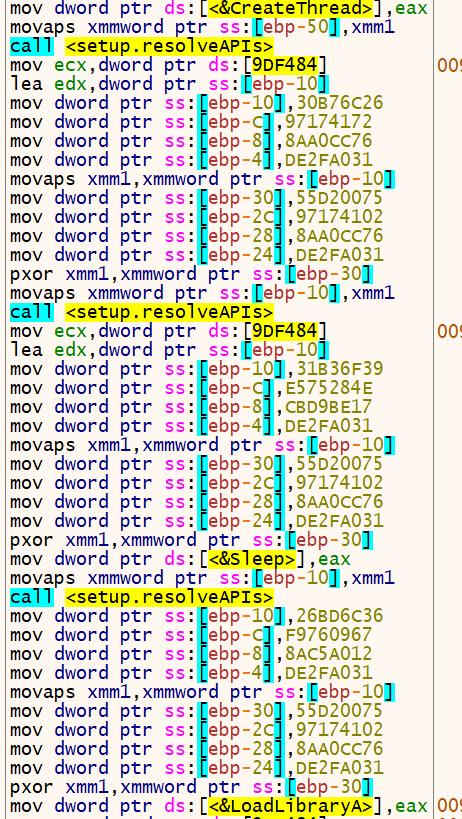
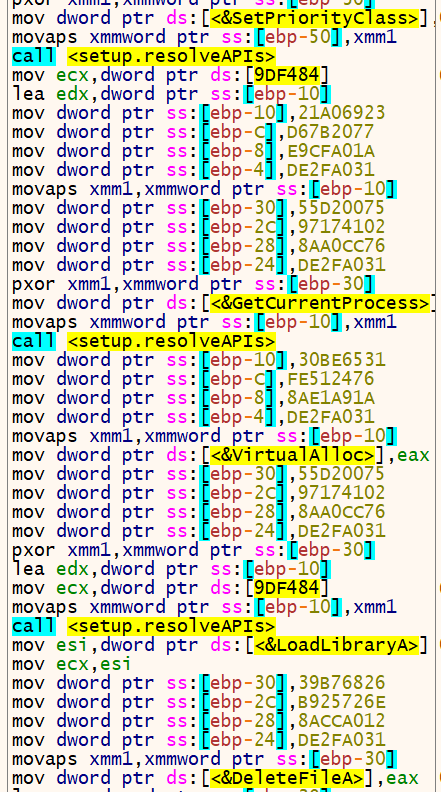
The process of deobfuscating API strings and resolving their addresses continues for the rest of the function. If we set a breakpoint just after the last call to resolveAPIs and scroll back up, we can see all the different APIs addresses that were resolved and patched in the .data section:
CreateThreadSleepLoadLibraryACloseHandleSetPriorityClassGetCurrentProcessVirtualAllocDeleteFile
We can rename the function we have been examining to something like getAPIAddress.
We know from static analysis that the specimen already imports many of kernel32.dll’s APIs, but now we have discovered that this malware dynamically loads the kernel32 module and some of its APIs that could not be seen originally in the imports table. It is very possible that other DLLs are loaded using this same technique.
If you haven’t already allowed the malware to continue execution, go ahead press the F9 key several times until the program terminates. You will notice several exceptions occur and it seems as if nothing happened. Now, without exiting the program, click the restart button or press the Ctrl+F2 keys. Your labeling and breakpoints should all remain intact.
Highlight the instruction just past the getAPIAddresses function we labeled earlier and press the F4 key to run execution up until that line. Your debugger should look similar to the screenshot below.
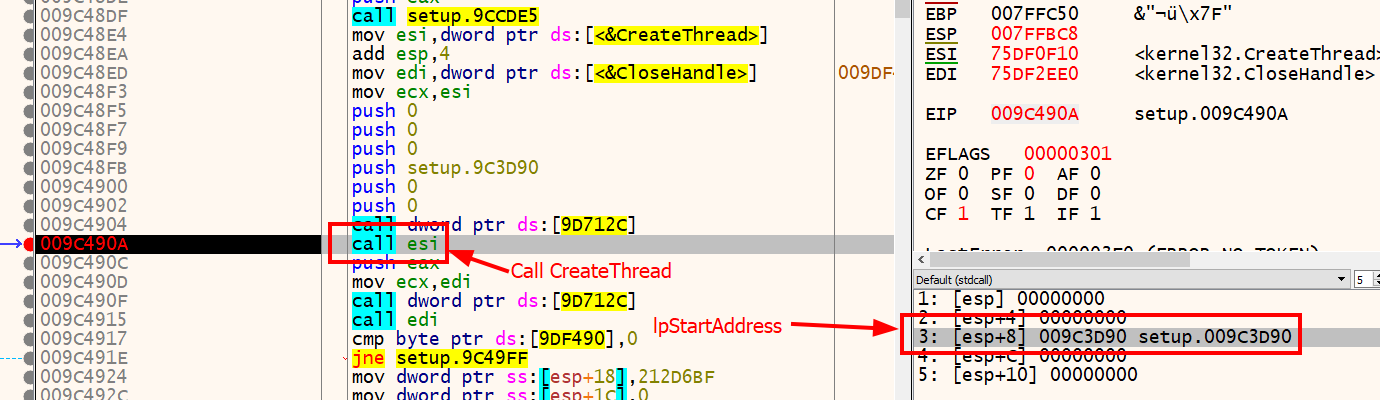
This will patch all the API addresses we discovered earlier and make it easier to see where they are called within the WinMain function. If we scroll down some, we eventually see the address of CreateThread loaded into the esi register and called. This function will create a new thread and start executing instructions at a specified address in virtual memory. Let’s set a breakpoint on the call to esi at memory address 0x009C490A, run the program, and examine the third parameter which should contain the lpStartAddress or the virtual memory address that execution will begin.
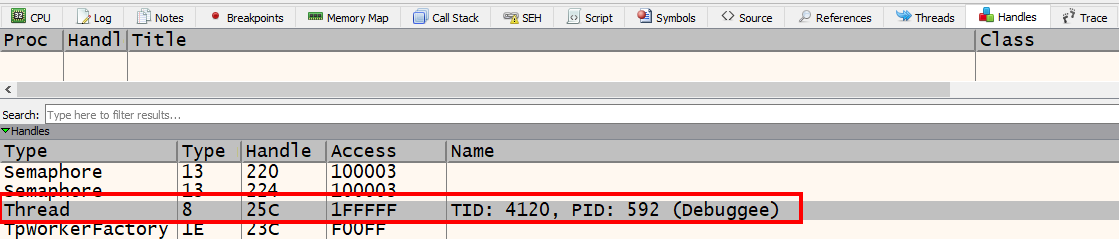
If we step over the call esi instruction and look at the eax register, we see the return value 25c (this will vary). CreateThread’s return value is a HANDLE type.
HANDLE CreateThread(
  [in, optional]  LPSECURITY_ATTRIBUTES   lpThreadAttributes,
  [in]            SIZE_T                  dwStackSize,
  [in]            LPTHREAD_START_ROUTINE  lpStartAddress,
  [in, optional]  __drv_aliasesMem LPVOID lpParameter,
  [in]            DWORD                   dwCreationFlags,
  [out, optional] LPDWORD                 lpThreadId
);
So 25c is a handle to the newly created thread. If we click the handles tab, right-click anywhere in the view, and click “refresh”, we get a list of handles. We can sort by type and scroll until we see “Thread”. There is only one thread handle created and we can see its handle value is 25c.
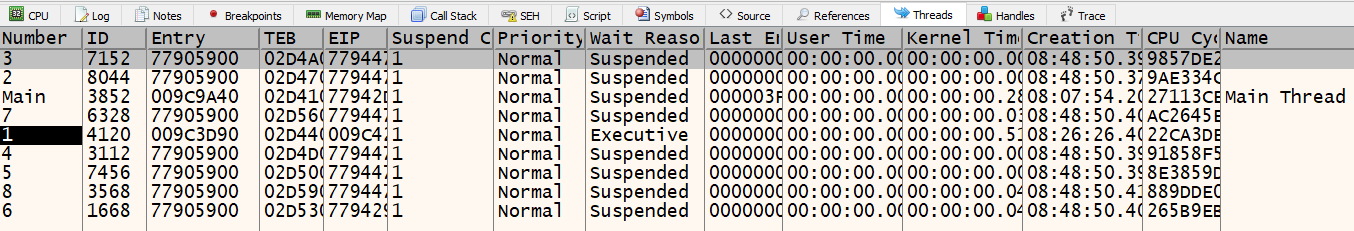
Let’s set a breakpoint on the lpStartAddress which in my case is 0x009C3D90 and run the program. When the program breaks on the address, we can click on the “Threads” tab and notice that there is a new thread number labeled “1” with an entry of 0x009C3D90.

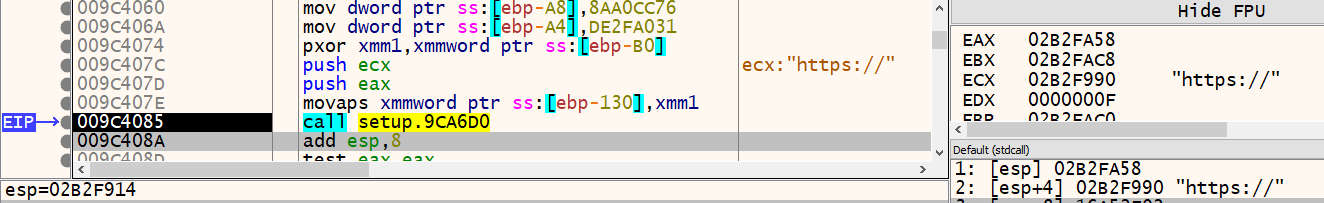
Scrolling through the function starting at 0x009C3D90, we see multiple function calls. Some are regular Windows API calls and some are not labeled. We also see more stack strings. Let’s deobfuscate these strings using the same techniques from before.
The first string we discover is wininet.dll

The next string is https://
We can see more and more strings come into view as we step through the function. It looks like there’s an IP address of 51.78.186.149, the folder path C:\Windows\Users\User\Documents, and a strange DLL located in the folder with a long nonsensical name.
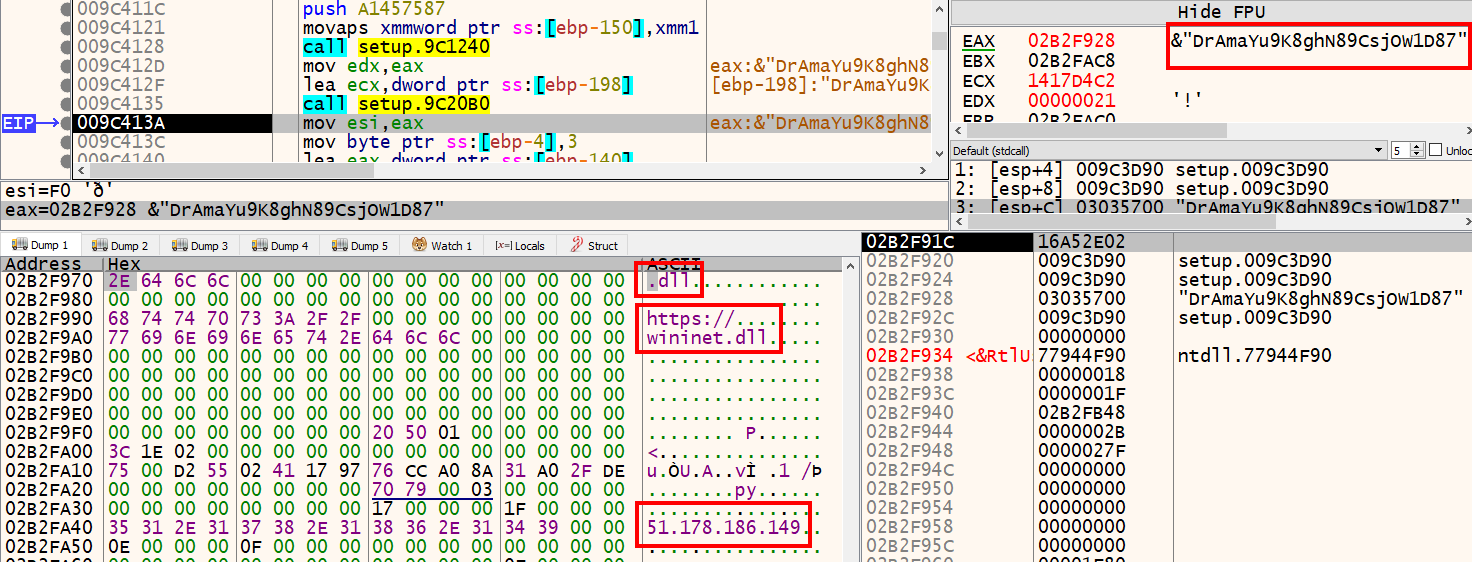
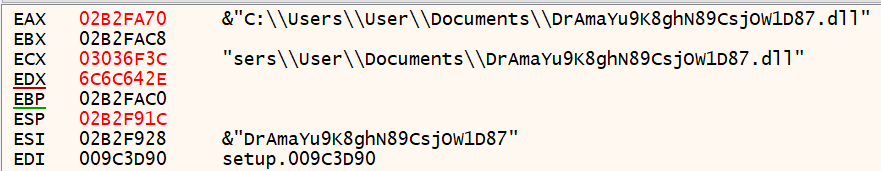
These are signs of a download happening in the current user’s Documents directory.
Continue stepping through the instructions and analyze the string data that x32dbg reveals. We stepped over many functions calls during this process and as a result, we triggered multiple threads. The “Threads” tab now contains 9 different threads.
Eventually, we hit a call to RtlExitUserThread which ends the calling thread and stops debugging.
We could go on and on examining each subroutine and thread but this would take up a lot of time. I like to take a targeted approach to code analysis. For example, if we come across some encrypted data that is sent over the network and we want to know what it is, we can locate encryption APIs or custom XOR encryption functions, set breakpoints just before the routine begins, and examine the function parameters for the location of the data in memory.
Using code analysis alone makes it difficult to determine what the malware needs to continue execution. Typically, code analysis is performed after behavioral analysis but I wanted to preserve the bulk of the IOCs we will discover in Part IV: Behavioral Analysis.
Part III Conclusion
In Part III of this series, we became familiar with x32dbg debugger, deobfuscated stack strings dynamically by setting breakpoints and examining memory, identified the purpose of a couple of functions and labeled them accordingly, and discovered that the specimen uses multiple threads to carry out its operation, making it slightly more difficult to follow its code paths.
In Part IV of the series we will be performing Behavioral Analysis which involves setting up a custom sandbox environment using both REMnux and FlareVM, and detonating the malware to log everything it does on the operating system and the network.
Thank you for reading and let me know if you found this useful.